
Class 9 Maths · Ganita Manjari Part 2 · Chapter 10
NCERT Solutions for Class 9 Maths Chapter 10 — How Quantities Combine: Understanding Data
Step-by-step solutions to all 33 questions of Exercise 10.1 to 10.5 and the End-of-Chapter exercises — weighted average, mixtures, custom weights, stacked bar charts and 100% stacked bar charts — with the NCERT figures and clear diagrams.
Exercise 10.1 — Average of averages and mixtures
NCERT page 13
Exercise 10.1 · Combined average
Q1The average score of students on a test in Section A is 72 and that of students in Section B is 76. What is the combined average of both the sections given that Section A has 30 students and Section B has 25 students?
First, understand the question
Two sections wrote the same test. Section A is bigger (30 students) than Section B (25 students). We have to find the average marks of all 55 students taken together.
Given
- Section A: 30 students, average 72
- Section B: 25 students, average 76
To find
- Average of both sections together
Write this in your exam
Total marks of Section A = 72 × 30 = 2160
Total marks of Section B = 76 × 25 = 1900
Total students = 30 + 25 = 55
Combined average = (2160 + 1900) ÷ 55 = 4060 ÷ 55 ≈ 73.82
∴ The combined average of both sections is 73.82.
Show step-by-step solutionHide step-by-step solution
Find the total marks of Section A
Average tells us the marks of one student. Multiply by the number of students to get the total marks.
Total of Section A = 72 × 30 = 2160Find the total marks of Section B
Do the same for Section B.
Total of Section B = 76 × 25 = 1900Add the marks and add the students
Total marks = 2160 + 1900 = 4060Total students = 30 + 25 = 55Divide total marks by total students
Combined average = 406055 = 73.818… ≈ 73.82
Exercise 10.1 · Equal quantities
Q2A farmer mixes three equal quantities of fertilisers. The first one contains 110 nitrogen, the second contains 950 nitrogen, and the third contains 360 nitrogen. What is the fraction of nitrogen in the mixture?
First, understand the question
Think of three bags of fertiliser of the same size. Each bag has a different amount of nitrogen. The farmer pours all three into one big bag. What part of the big bag is nitrogen?
Given
- Three equal quantities
- Nitrogen: 110, 950, 360
To find
- Fraction of nitrogen in the mixture
Write this in your exam
Since the quantities are equal, nitrogen in mixture = average of the fractions.
= (1/10 + 9/50 + 3/60) ÷ 3
= (30/300 + 54/300 + 15/300) ÷ 3
= 99/300 ÷ 3 = 99/900 = 11/100
∴ Fraction of nitrogen in the mixture = 11/100.
The three quantities are equal, so the nitrogen in the mixture is the simple average of the three fractions.
Show step-by-step solutionHide step-by-step solution
Write the average of the three fractions
All the bags are of equal size, so each one counts the same. Add the three fractions and divide by 3.
Nitrogen = 110 + 950 + 3603Make the denominators the same
We can add fractions only when the denominators are equal. LCM of 10, 50 and 60 is 300.
110 = 30300, 950 = 54300, 360 = 15300Add the fractions
30300 + 54300 + 15300 = 99300Divide by 3 and simplify
99300 ÷ 3 = 99900 = 11100
Exercise 10.1 · Śrīdharācārya, Pāṭīgaṇita (c. 750 CE)
(Śrīdharācārya, Pāṭīgaṇita, c. 750 CE) In ancient India, Varṇa was the measure of gold purity. A purity of 16 varṇa meant pure gold; in general, a purity of k varṇa meant that the gold-alloy was k/16 gold and the rest impurities. (Now the term used is karat; 16 Varna = 24 karat.)
Q3Suppose a goldsmith melts together three pieces of gold: 9 units at 12 varṇa, 5 units at 10 varṇa, and 17 units at 11 varṇa. Find the purity in varṇa of the combined gold.
First, understand the question
A goldsmith melts three pieces of gold into one piece. The pieces have different weights and different purity. A heavier piece affects the final purity more. We have to find the purity of the new piece.
Given
- Piece 1: 9 units, 12 varṇa
- Piece 2: 5 units, 10 varṇa
- Piece 3: 17 units, 11 varṇa
To find
- Purity (in varṇa) of the combined gold
Write this in your exam
Purity of combined gold = (9 × 12 + 5 × 10 + 17 × 11) ÷ (9 + 5 + 17)
= (108 + 50 + 187) ÷ 31
= 345 ÷ 31 = 11 4/31 ≈ 11.13 varṇa
∴ Purity of the combined gold ≈ 11.13 varṇa.
Let P = purity of the combined gold.
Show step-by-step solutionHide step-by-step solution
Multiply each weight by its purity
A heavier piece must count more, so we multiply each purity by the weight of that piece.
Piece 1: 9 × 12 = 108Piece 2: 5 × 10 = 50Piece 3: 17 × 11 = 187Add these products
108 + 50 + 187 = 345Add the weights
9 + 5 + 17 = 31 unitsDivide the sum of products by the total weight
Purity = 34531 = 11431 ≈ 11.13 varṇa
Exercise 10.1 · Writing an expression
Q4The average rainfall per day in the months of May, June, and July in a certain location are 3.5 mm, 10 mm and 8.7 mm respectively. Write an expression that gives their combined average.
First, understand the question
We know the average rainfall per day for three months. The months do not have the same number of days, so each month must count according to its number of days. We only have to write an expression; finding its value is a bonus.
Given
- May: 3.5 mm per day (31 days)
- June: 10 mm per day (30 days)
- July: 8.7 mm per day (31 days)
To find
- An expression for the combined average rainfall per day
Write this in your exam
Weights = number of days: May 31, June 30, July 31
Combined average = (3.5 × 31 + 10 × 30 + 8.7 × 31) ÷ (31 + 30 + 31)
= (108.5 + 300 + 269.7) ÷ 92 = 678.2 ÷ 92
∴ Combined average ≈ 7.37 mm per day.
Weights = number of days: May 31, June 30, July 31. Let A = combined average.
Show step-by-step solutionHide step-by-step solution
Find the weight of each month
Each average is for one day. A month with more days adds more rain, so the number of days is the weight.
May = 31 days, June = 30 days, July = 31 daysFind the total rain of each month
Total rain = average per day × number of days.
May: 3.5 × 31 = 108.5 mmJune: 10 × 30 = 300 mmJuly: 8.7 × 31 = 269.7 mmWrite the expression for the combined average
Combined average = total rain ÷ total number of days.
Combined average = 3.5 × 31 + 10 × 30 + 8.7 × 3131 + 30 + 31Find its value (optional)
= 108.5 + 300 + 269.792 = 678.292 ≈ 7.37 mm per day
Exercise 10.1 · Kashayam / Kadha
Q5Calculate the concentration of spice mix in these two scenarios.
- A 100 mL kashayam/kadha with 5% spice mix, a 200 mL one with 10% spice mix, and a 300 mL one with 15% spice mix are combined.
- A 300 mL kashayam/kadha with 5% spice mix, a 200 mL one with 10% spice mix, and a 100 mL one with 15% spice mix are mixed.
First, understand the question
Three glasses of kadha with different spice strengths are poured together. A bigger glass affects the final strength more. We do this for two cases in which the glass sizes are swapped.
Given
- (i) 100 mL at 5%, 200 mL at 10%, 300 mL at 15%
- (ii) 300 mL at 5%, 200 mL at 10%, 100 mL at 15%
To find
- Concentration of spice mix in each mixture
Write this in your exam
(i) Concentration = (100 × 5 + 200 × 10 + 300 × 15) ÷ (100 + 200 + 300)
= (500 + 2000 + 4500) ÷ 600 = 7000 ÷ 600 ≈ 11.67%
(ii) Concentration = (300 × 5 + 200 × 10 + 100 × 15) ÷ (300 + 200 + 100)
= (1500 + 2000 + 1500) ÷ 600 = 5000 ÷ 600 ≈ 8.33%
∴ (i) ≈ 11.67% (ii) ≈ 8.33%
Let C = concentration of the spice mix.
(i)
(ii)
Show step-by-step solutionHide step-by-step solution
Case (i): multiply each quantity by its spice %
The bigger the glass, the more it adds to the mixture, so the quantity is the weight.
100 × 5 = 500, 200 × 10 = 2000, 300 × 15 = 4500Case (i): divide by the total quantity
Concentration = 500 + 2000 + 4500100 + 200 + 300 = 7000600 ≈ 11.67%The largest quantity has 15% spice, so the answer is above 10%. Case (ii): multiply each quantity by its spice %
Now the biggest glass (300 mL) is the weakest one (5%).
300 × 5 = 1500, 200 × 10 = 2000, 100 × 15 = 1500Case (ii): divide by the total quantity
Concentration = 1500 + 2000 + 1500300 + 200 + 100 = 5000600 ≈ 8.33%Now the largest quantity has 5% spice, so the answer is below 10%.
Exercise 10.2 — Custom weights (ratio of assessments)
NCERT page 14
Exercise 10.2 · Which expression is correct?
Q1Savitri’s marks in Kashmiri are as follows: 35 out of 50 in internal tests, 44 out of 60 in the project, and 80 out of 100 in the final exam. The annual percentage score is calculated by combining the internals, project, and final exam in the ratio 3 : 4 : 5. Which of the following expression(s) gives her annual score (as a percentage) in Kashmiri?
- 35 × 3 + 44 × 4 + 80 × 53 + 4 + 5
- (35/100) × 3 + (44/100) × 4 + (80/100) × 53 + 4 + 5
- (35/50) × 3 + (44/60) × 4 + (80/100) × 53 + 4 + 5 × 100
- (35/50 × 100) × 3 + (44/60 × 100) × 4 + (80/100 × 100) × 53 + 4 + 5
First, understand the question
Savitri’s three marks are out of different totals (50, 60 and 100), so they cannot be added directly. They are combined in the ratio 3 : 4 : 5. We have to choose the expression(s) that give her annual percentage.
Given
- Internal tests: 35 out of 50 (weight 3)
- Project: 44 out of 60 (weight 4)
- Final exam: 80 out of 100 (weight 5)
To find
- The correct expression(s) for her annual percentage
Write this in your exam
Each mark must first be changed into a fraction (or %) of its own total.
Internals = 35/50 = 70%, Project = 44/60 ≈ 73.33%, Final = 80/100 = 80%
Annual % = (70 × 3 + 73.33 × 4 + 80 × 5) ÷ (3 + 4 + 5) ≈ 75.28%
(i) and (ii) are wrong, as they do not use the correct totals.
∴ Correct expressions: (iii) and (iv).
Change each mark into a percentage of its own total:
Let S = annual score.
(i) and (ii) are wrong, because they do not divide each mark by its own total.
∴ Correct expressions: (iii) and (iv).
Show step-by-step solutionHide step-by-step solution
Change each mark into a percentage
Marks out of different totals can be compared only after changing them into percentages.
Assessment Marks Percentage (x) Weight (w) Internal tests 35 / 50 70% 3 Project 44 / 60 73.33% 4 Final exam 80 / 100 80% 5 Check each expression
A correct expression divides each mark by its own total, then takes the weighted average in the ratio 3 : 4 : 5.
Option Correct? Reason (i) ✘ No Raw marks used, but they are out of different totals (50, 60, 100) (ii) ✘ No Treats every test as if it were out of 100 (iii) ✔ Yes Correct fractions → weighted mean → × 100 gives % (iv) ✔ Yes Each converted to % first, then weighted mean Find her actual annual score
70 × 3 + 73.33 × 4 + 80 × 512 = 210 + 293.33 + 40012 = 903.3312 ≈ 75.28%The final exam has the highest weightage (5 out of 12).
Exercise 10.3 — Mixed practice on weighted mean
NCERT page 15–18
Exercise 10.3 · Profit percentage
Q1A stationery shop owner made ₹8000 selling books, of which 30% is the profit amount, and ₹1000 selling book covers, of which 50% is the profit amount. What is the percentage of profit on the total sales?
First, understand the question
The shopkeeper sells two things. Each has a different profit %, and the sales of books are much bigger than the sales of covers. We have to find the profit % on the total sales.
Given
- Books: sales ₹8000, profit 30%
- Book covers: sales ₹1000, profit 50%
To find
- Profit % on the total sales
Write this in your exam
Profit on books = 30% of ₹8000 = ₹2400
Profit on covers = 50% of ₹1000 = ₹500
Total profit = ₹2900, Total sales = ₹9000
Profit % = 2900 ÷ 9000 × 100 ≈ 32.22%
∴ Profit on the total sales ≈ 32.22%.
Profit on each item:
Show step-by-step solutionHide step-by-step solution
Find the profit on each item
Profit = profit % × sales.
Books: 30100 × 8000 = ₹2400Covers: 50100 × 1000 = ₹500Add the profits and add the sales
Total profit = 2400 + 500 = ₹2900Total sales = 8000 + 1000 = ₹9000Find the profit percentage
Profit % = 29009000 × 100 ≈ 32.22%Green part / full bar = profit share. Total: 2900 out of 9000
Exercise 10.3 · Adding one value
Q2A white stork’s migration is tracked. The average daily distance travelled, calculated over 20 days, is 44.5 km. On the 21st day, it flew 55 km. What is the average daily distance travelled over these 21 days? Make a guess before you calculate.
First, understand the question
We know the stork’s average distance for 20 days. One more day (55 km) is added. We have to guess first, and then find the new average for all 21 days.
Given
- Average for 20 days = 44.5 km
- Distance on day 21 = 55 km
To find
- Average daily distance for 21 days
Write this in your exam
Distance in 20 days = 44.5 × 20 = 890 km
Distance in 21 days = 890 + 55 = 945 km
New average = 945 ÷ 21 = 45 km
∴ Average daily distance over 21 days = 45 km.
Show step-by-step solutionHide step-by-step solution
Make a guess
Guess: Only one day is added, so the average will rise only slightly above 44.5 km (around 45 km).
Find the total distance of 20 days
Total = average × number of days.
44.5 × 20 = 890 kmAdd day 21 and divide by 21
New average = 890 + 5521 = 94521 = 45 km55 km is much higher, but against 20 days its weight is only 1.
Exercise 10.3 · Two different solutes
Q3A 600 mL solution with 5% salt is mixed with a 300 mL solution with 8% sugar. What are the concentrations of salt and sugar in the mixture?
- Salt: 5%, Sugar: 8%
- Salt: 13%, Sugar: 3%
- Salt: 6%, Sugar: 6%
- Salt: 5.55%, Sugar: 8.88%
- Salt: 3.33%, Sugar: 2.67%
- Salt: 4.1%, Sugar: 7.08%
First, understand the question
Salt is only in the first solution and sugar is only in the second. When they are mixed, each one spreads through the whole 900 mL. We have to find the new % of salt and of sugar, and choose the right option.
Given
- 600 mL solution with 5% salt
- 300 mL solution with 8% sugar
To find
- Concentration of salt and of sugar in the mixture
Write this in your exam
Salt = 5% of 600 mL = 30 mL
Sugar = 8% of 300 mL = 24 mL
Total volume = 600 + 300 = 900 mL
Salt % = 30 ÷ 900 × 100 ≈ 3.33%, Sugar % = 24 ÷ 900 × 100 ≈ 2.67%
∴ Option (v): Salt ≈ 3.33%, Sugar ≈ 2.67%.
∴ Option (v): Salt ≈ 3.33%, Sugar ≈ 2.67%.
Show step-by-step solutionHide step-by-step solution
Find the amount of salt and of sugar
Amount = % × volume of that solution.
Salt = 5100 × 600 = 30 mLSugar = 8100 × 300 = 24 mLFind the total volume
After mixing, both salt and sugar are spread through the full mixture.
Total volume = 600 + 300 = 900 mLFind each concentration
Salt % = 30900 × 100 ≈ 3.33%Sugar % = 24900 × 100 ≈ 2.67%Both concentrations decrease, because each substance gets diluted.
Exercise 10.3 · Panipuri stall
Q4At a panipuri (golgappa) stall, the concentration of spice in the pani (spiced water) was 8%. Many customers complained that it was too spicy. What quantity of regular water should be mixed into the 10 litres of pani so that the spice level is reduced to (3/4)th of the original concentration?

First, understand the question
The pani is too spicy (8%). Plain water has no spice, so adding it only increases the total volume and the spice gets diluted. We want the spice level to become ¾ of 8%, that is 6%.
Given
- 10 L of pani with 8% spice
- Plain water has 0% spice
- Required spice level = ¾ × 8% = 6%
To find
- Litres of plain water to be added
Write this in your exam
Let y litres of water be added.
Required spice level = 3/4 × 8% = 6%
(10 × 8 + y × 0) ÷ (10 + y) = 6
80 = 60 + 6y ⇒ 6y = 20 ⇒ y = 10/3
∴ 10/3 L ≈ 3.33 L of water should be added.
Let y litres of water be added. Required spice level = ¾ × 8% = 6%.
Show step-by-step solutionHide step-by-step solution
Find the required spice level
34 × 8% = 6%Take the unknown quantity as y
Let y litres of plain water (0% spice) be added. Use the weighted average.
10 × 8 + y × 010 + y = 6Solve for y
80 = 6(10 + y) ⇒ 80 = 60 + 6y ⇒ 6y = 20 ⇒ y = 103 ≈ 3.33 LCheck the answer
Check: spice = 0.8 L, total = 13.33 L ⇒ 0.8 ÷ 13.33 = 0.06 = 6% ✔
The quantity of spice (0.8 L) stays the same; only the total volume increases.
Exercise 10.3 · Fitness evaluation
Q5A physical fitness evaluation is being undertaken. The final marks are calculated by combining the marks for strength, flexibility, and agility in the ratio 4 : 5 : 6. Rashi has scored 60, 65, and 70. Keerthi has scored 55, 65, and 75 respectively.
- Find out whose total is more without calculating.
- What are their final marks?
First, understand the question
Rashi and Keerthi are judged on three things in the ratio 4 : 5 : 6. Agility has the biggest weight. First we decide who is ahead just by looking, and then we find the final marks.
Given
- Weights: strength 4, flexibility 5, agility 6
- Rashi: 60, 65, 70
- Keerthi: 55, 65, 75
To find
- (i) Whose total is more, without calculating
- (ii) Final marks of both
Write this in your exam
(i) Keerthi has 5 marks less in strength (weight 4) but 5 marks more in agility (weight 6). Agility has more weight, so Keerthi’s total is more.
(ii) Rashi = (60 × 4 + 65 × 5 + 70 × 6) ÷ 15 = 985 ÷ 15 ≈ 65.67
Keerthi = (55 × 4 + 65 × 5 + 75 × 6) ÷ 15 = 995 ÷ 15 ≈ 66.33
∴ Keerthi scores more: Rashi ≈ 65.67, Keerthi ≈ 66.33.
(i) Keerthi has 5 marks less in strength (weight 4) but 5 marks more in agility (weight 6). Agility has more weight, so Keerthi’s total is more.
(ii)
∴ Keerthi scores more (66.33 > 65.67).
Show step-by-step solutionHide step-by-step solution
(i) Compare the two students part by part
Strength (w = 4) Flexibility (w = 5) Agility (w = 6) Rashi 60 65 70 Keerthi 55 (−5) 65 (same) 75 (+5) Compared with Rashi, Keerthi has 5 marks less in strength (weight 4) and 5 marks more in agility (weight 6). Flexibility is the same. Agility has the larger weight, so the 5 marks gained count for more than the 5 marks lost. Keerthi’s total will be more.
(ii) Find Rashi’s final marks
Multiply each score by its weight, add, and divide by the total weight (4 + 5 + 6 = 15).
Rashi = 60 × 4 + 65 × 5 + 70 × 64 + 5 + 6 = 240 + 325 + 42015 = 98515 ≈ 65.67(ii) Find Keerthi’s final marks
Keerthi = 55 × 4 + 65 × 5 + 75 × 615 = 220 + 325 + 45015 = 99515 ≈ 66.33
Exercise 10.3 · Restaurant ratings
Q6A restaurant collected ratings from 10 customers on a scale of 1 to 5. The resulting data is shown in the table below.
| 5★ | 4★ | 3★ | 2★ | 1★ | |
|---|---|---|---|---|---|
| Food | 5 | 3 | 2 | 0 | 0 |
| Ambience | 0 | 4 | 5 | 1 | 0 |
| Service | 1 | 2 | 2 | 4 | 1 |

First, understand the question
10 customers rated food, ambience and service from 1★ to 5★. First we find the average rating of each one. Then we combine these three averages using the weights 6 : 5 : 4.
Given
- Ratings of 10 customers (table above)
- Weights: food 6, ambience 5, service 4
To find
- The combined average rating
Write this in your exam
Food = (5×5 + 4×3 + 3×2) ÷ 10 = 43 ÷ 10 = 4.3
Ambience = (4×4 + 3×5 + 2×1) ÷ 10 = 33 ÷ 10 = 3.3
Service = (5×1 + 4×2 + 3×2 + 2×4 + 1×1) ÷ 10 = 28 ÷ 10 = 2.8
Average = (4.3 × 6 + 3.3 × 5 + 2.8 × 4) ÷ (6 + 5 + 4) = 53.5 ÷ 15 ≈ 3.57
∴ Average rating ≈ 3.57 ★
Average of each metric (F = food, A = ambience, S = service):
(For S: 5×1 = 5, 4×2 = 8, 3×2 = 6, 2×4 = 8, 1×1 = 1)
Show step-by-step solutionHide step-by-step solution
Find the average rating of each metric
Multiply each star value by the number of customers who gave it, add, and divide by 10.
Food = 5×5 + 4×3 + 3×210 = 4310 = 4.3Ambience = 4×4 + 3×5 + 2×110 = 3310 = 3.3Service = 5×1 + 4×2 + 3×2 + 2×4 + 1×110 = 2810 = 2.8Combine them using the weights 6 : 5 : 4
Average rating = 4.3 × 6 + 3.3 × 5 + 2.8 × 46 + 5 + 4 = 25.8 + 16.5 + 11.215 = 53.515 ≈ 3.57
Exercise 10.3 · Langurs in an animal facility
Q7The following table shows the weight data of langurs in an animal facility. Without doing any computations, can you tell whether there are more male langurs or more female langurs? Or are they equal in number?
| Male langurs | Female langurs | All langurs | |
|---|---|---|---|
| Average weight | 16.5 kg | 13.8 kg | 14.925 kg |
| Number of langurs | x | y | 60 |
- Which of the following expression(s) describes the given scenario?
(a) 16.5x + 13.8yx + y = 14.925 (b) 16.5x + 13.8y60 = – 14.925 (c) 16.5x + 13.8y2 = – 14.925 (d) 16.5x + 13.8y16.5 + 13.8 = – 14.925 - Find out how many male langurs are present.
- A female langur weighing 15.2 kg is admitted to the facility. What is the average weight of the female langurs after this?
- Two male langurs weighing 16.9 kg and 16.1 kg are released from the facility. What is the average weight of the male langurs after this?
- Now, suppose one of the male langurs lost 1 kg of weight. What is the average weight of all the male langurs after this?
First, understand the question
We know the average weight of the male langurs, the female langurs and all 60 langurs. The combined average always leans towards the bigger group. Then we use the weighted average when langurs are added, removed or lose weight.
Given
- Males: average 16.5 kg, number x
- Females: average 13.8 kg, number y
- All langurs: average 14.925 kg, total 60
To find
- More males or more females? Correct expression(s)
- Number of males, and the new averages in (iii), (iv), (v)
Write this in your exam
14.925 is closer to 13.8 than to 16.5, so there are more female langurs.
(i) (a) and (b) are correct (average = total weight ÷ total number, and x + y = 60).
(ii) 16.5x + 13.8(60 − x) = 14.925 × 60 = 895.5 ⇒ 2.7x = 67.5 ⇒ x = 25 males
(iii) Female total = 13.8 × 35 = 483 ⇒ (483 + 15.2) ÷ 36 = 498.2 ÷ 36 ≈ 13.84 kg
(iv) Male total = 16.5 × 25 = 412.5 ⇒ (412.5 − 16.9 − 16.1) ÷ 23 = 379.5 ÷ 23 = 16.5 kg
(v) (379.5 − 1) ÷ 23 = 378.5 ÷ 23 ≈ 16.46 kg
∴ More females; (a) and (b); 25 males; 13.84 kg; 16.5 kg; 16.46 kg
14.925 is closer to 13.8 than to 16.5, so there are more female langurs.
(i) (a) and (b) are correct, because average = total weight ÷ total number, and x + y = 60.
(ii) Let males = x, so females = 60 − x. Total weight = 14.925 × 60 = 895.5 kg.
So there are 25 males and 35 females.
(iii)
(iv)
(v)
∴ More female langurs; (i) (a) and (b); (ii) 25 males; (iii) ≈ 13.84 kg; (iv) 16.5 kg; (v) ≈ 16.46 kg
Show step-by-step solutionHide step-by-step solution
Without calculation: more males or more females?
The combined average is always closer to the bigger group.
The combined average 14.925 kg is closer to the female average 13.8 kg (gap 1.125) than to the male average 16.5 kg (gap 1.575). Hence there are more female langurs.
Ratio of gaps 1.125 : 1.575 = 5 : 7, so Males : Females = 5 : 7 (the ratio is reversed). (i) Choose the correct expression(s)
Average weight = total weight ÷ total number = (16.5x + 13.8y) ÷ (x + y). So (a) is correct. Since x + y = 60, (b) is also correct. The minus sign before 14.925 in (b), (c) and (d) looks like a printing mistake in the book, because an average weight can never be negative. In (c) and (d) the denominators (2 and 16.5 + 13.8 = 30.3) are not the number of langurs, so they are wrong.
(ii) Find the number of male langurs
x + y = 60 and 16.5x + 13.8y = 14.925 × 60 = 895.516.5x + 13.8(60 − x) = 895.5 ⇒ 2.7x + 828 = 895.5 ⇒ 2.7x = 67.5 ⇒ x = 25So 25 males and 35 females. (Check: 5 : 7 = 25 : 35 ✔)
(iii) A female langur of 15.2 kg joins
Female total = 13.8 × 35 = 483 kg ⇒ new average = 483 + 15.236 = 498.236 ≈ 13.84 kg(iv) Two male langurs are released
Male total = 16.5 × 25 = 412.5 kg ⇒ 412.5 − 16.9 − 16.123 = 379.523 = 16.5 kgThe average remains the same, because the average of the two langurs released is also (16.9 + 16.1) ÷ 2 = 16.5 kg.
(v) One male langur loses 1 kg
379.5 − 123 = 378.523 ≈ 16.46 kg (average decreases by 1/23 ≈ 0.04 kg)
Exercise 10.3 · Water from the Dead Sea
Q8Dorjee has collected 1 litre of water from the Dead Sea! Using the information in the table, answer the following questions. A calculator can be used if necessary.
| Water Source | Salinity |
|---|---|
| Dead Sea | ≈ 34% |
| Other seas and oceans | ≈ 3.5% |
| Ground water | ≈ 0.01% |
| Purified drinking water | ≈ 0.001% |
- What is the salinity of the mixture if he mixes 1 litre of water from the Dead Sea with 2 litres of purified drinking water?
- Is it possible to mix water from the Dead Sea and purified drinking water to get a mixture with the salinity of groundwater? Why/Why not? What quantity of purified drinking water should Dorjee mix with 1 litre of water from the Dead Sea to get a mixture having the salinity of groundwater?
- Is it possible to mix water from the Dead Sea and groundwater to get a mixture with the salinity of purified drinking water? Why/Why not? What quantity of groundwater should he mix with 1 litre of water from the Dead Sea to get a mixture having the salinity of purified drinking water?

First, understand the question
Dorjee mixes very salty Dead Sea water with less salty water. The salinity of a mixture always lies between the salinities of the two waters that are mixed. We use the weighted average to find the salinity, or the quantity needed.
Given
- Dead Sea ≈ 34%, groundwater ≈ 0.01%
- Purified drinking water ≈ 0.001%
- 1 litre of Dead Sea water
To find
- (i) Salinity with 2 L of purified water
- (ii) Purified water needed to reach 0.01%
- (iii) Can groundwater bring it down to 0.001%?
Write this in your exam
(i) Salinity = (1 × 34 + 2 × 0.001) ÷ (1 + 2) = 34.002 ÷ 3 ≈ 11.33%
(ii) Yes, because 0.01% lies between 0.001% and 34%.
(34 + 0.001y) ÷ (1 + y) = 0.01 ⇒ 0.009y = 33.99 ⇒ y ≈ 3776.7 L
(iii) No. 0.001% is less than both 34% and 0.01%, and a mixture can never be less salty than both of its parts.
∴ (i) ≈ 11.33% (ii) Yes, ≈ 3777 L (iii) Not possible
(i)
(ii) Yes, because 0.01% lies between 0.001% and 34%. Let y litres of purified water be mixed.
(iii) No. 0.001% is less than both 34% and 0.01%, and a mixture can never be less salty than both of its parts.
∴ (i) ≈ 11.33% (ii) Yes, about 3777 L (iii) Not possible
Show step-by-step solutionHide step-by-step solution
(i) Mix 1 L of Dead Sea water with 2 L of purified water
The quantity of each water is its weight.
Salinity = 1 × 34 + 2 × 0.0011 + 2 = 34.0023 ≈ 11.33%(ii) Check if the salinity of groundwater is possible
The salinity of a mixture always lies between the salinities of the two liquids. Since 0.01% (groundwater) lies between 0.001% and 34%, it is possible. Let y litres of purified water be mixed:
1 × 34 + y × 0.0011 + y = 0.01 ⇒ 34 + 0.001y = 0.01 + 0.01y ⇒ 0.009y = 33.99 ⇒ y ≈ 3776.7 L(iii) Check if the salinity of purified water is possible
The salinity of purified water (0.001%) is less than both the Dead Sea (34%) and groundwater (0.01%). A mixture can never be less salty than both of its parts; it will always be at least 0.01%.
34 + 0.01y = 0.001(1 + y) ⇒ 0.009y = −33.999 ⇒ y is negative ✘ (impossible)A mixture of Dead Sea water and groundwater cannot go below 0.01% salinity.
Exercise 10.4 — Reading and making stacked bar charts
NCERT page 21–22
Exercise 10.4 · IUCN Red List
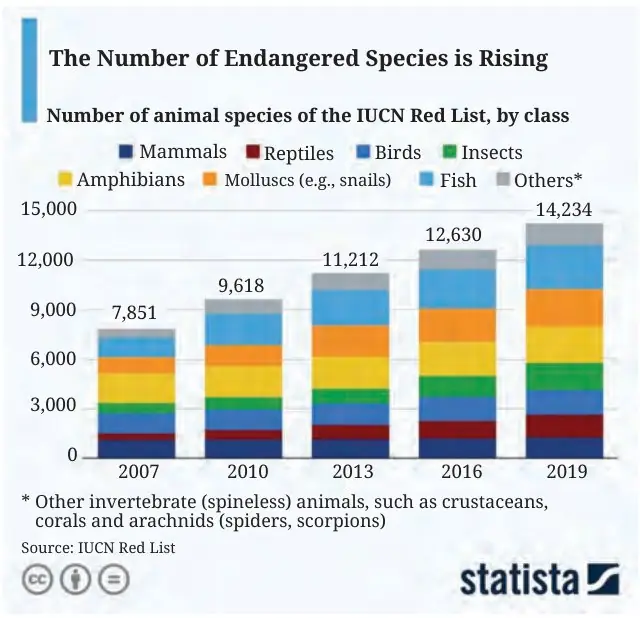
Q1The following stacked column chart shows the number of animal species in the IUCN Red List, by class, over time.
- What does the number 14,234 on the top of the column 2019 represent?
- Approximately how many reptile species were in the list in 2016?
- Which class(es) of species have seen a relatively small increase in count between 2007 and 2019?
First, understand the question
The stacked column chart shows how many animal species of each class were on the IUCN Red List in different years. Each coloured part is one class, and the number on top is the total of the whole column.
Given
- Stacked columns for 2007, 2010, 2013, 2016 and 2019
- Number on top of each column = total species
To find
- (i) Meaning of 14,234
- (ii) Reptile species in 2016
- (iii) Classes with a small increase from 2007 to 2019
Write this in your exam
(i) 14,234 is the total number of animal species (all classes together) on the IUCN Red List in 2019.
(ii) Reptiles in 2016 ≈ 2,200 − 1,200 ≈ 1,000 species.
(iii) Mammals, Birds and Amphibians, because their parts of the column stay almost the same size.
∴ (i) Total species in 2019 (ii) ≈ 1,000 (iii) Mammals, Birds, Amphibians
(i) 14,234 is the total number of animal species (all classes together) on the IUCN Red List in 2019.
(ii) Reptile part of the 2016 column:
(iii) Mammals, Birds and Amphibians, because their parts of the column stay almost the same size.
∴ (i) Total species in 2019 (ii) ≈ 1,000 (iii) Mammals, Birds, Amphibians
Show step-by-step solutionHide step-by-step solution
(i) Read the number on top
14,234 = the total number of animal species (all classes together: mammals, reptiles, birds, insects, amphibians, molluscs, fish and others) on the IUCN Red List in 2019. It is the sum of all the coloured parts of the 2019 column.
(ii) Read the reptile part of the 2016 column
In a stacked chart, the value of a part = its upper end − its lower end.
In the 2016 column, the reptile part (dark red) runs from about 1,200 to 2,200. Reptiles ≈ 2,200 − 1,200 ≈ 1,000 species.
(iii) Compare each class in 2007 and 2019
Class 2007 (approx.) 2019 (approx.) Change Mammals ≈ 1,100 ≈ 1,200 small ↑ Birds ≈ 1,250 ≈ 1,500 small ↑ Amphibians ≈ 1,800 ≈ 2,200 small ↑ Reptiles ≈ 350 ≈ 1,400 big ↑ (×4) Insects ≈ 600 ≈ 1,700 big ↑ Molluscs ≈ 1,000 ≈ 2,300 big ↑ Fish ≈ 1,300 ≈ 2,600 big ↑ (×2)
Exercise 10.4 · Complete the stacked bar charts
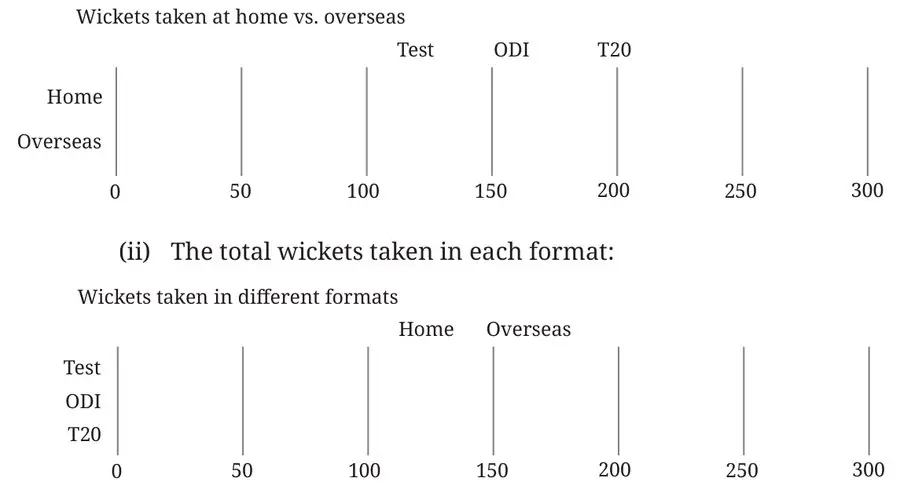
Q2Complete the stacked bar charts
| Test | ODI | T20 | |
|---|---|---|---|
| Home | 62 | 100 | 32 |
| Overseas | 172 | 49 | 71 |
- comparing the total wickets taken at home vs. overseas:
- the total wickets taken in each format:
First, understand the question
A bowler’s wickets are given for home and overseas matches in three formats. We have to draw two stacked bar charts: one with a bar for home and a bar for overseas, and one with a bar for each format.
Given
- Home: Test 62, ODI 100, T20 32
- Overseas: Test 172, ODI 49, T20 71
To find
- (i) Stacked bars: home vs overseas
- (ii) Stacked bars: one for each format
Write this in your exam
Totals: Home = 62 + 100 + 32 = 194, Overseas = 172 + 49 + 71 = 292
Test = 62 + 172 = 234, ODI = 100 + 49 = 149, T20 = 32 + 71 = 103
(i) Home bar: Test 0–62, ODI 62–162, T20 162–194
Overseas bar: Test 0–172, ODI 172–221, T20 221–292
(ii) Test: Home 0–62, Overseas 62–234; ODI: 0–100, 100–149; T20: 0–32, 32–103
∴ Draw the bars as shown in the solution.
Totals:
(i) Home bar: Test 0–62, ODI 62–162, T20 162–194. Overseas bar: Test 0–172, ODI 172–221, T20 221–292.
(ii) Test bar: Home 0–62, Overseas 62–234. ODI bar: 0–100, 100–149. T20 bar: 0–32, 32–103.
∴ Draw the bars as shown in the solution.
Show step-by-step solutionHide step-by-step solution
Find all the totals
The total decides the full length of each bar.
Test ODI T20 Total Home 62 100 32 194 Overseas 172 49 71 292 Total 234 149 103 486 (i) Draw the home and overseas bars
Start each part where the previous part ends.
Test first (0 to 62), then ODI (62 to 162), then T20 (162 to 194). (ii) Draw one bar for each format
The total length of each bar = total wickets in that format.
Exercise 10.5 — 100% stacked bar chart from a table
NCERT page 29
Exercise 10.5 · Smart-watch data
Q1The smart watch data of 5 people was tracked from Monday to Friday. The recorded data tells us how many hours each person spent lying down, sitting, and standing or moving around, etc., as shown in the following table.
Table 10.3: Average number of hours spent per day (Monday – Friday) lying down, sitting, and standing or moving around, etc., of 5 people
| Lying down | Sitting | Standing or Moving around etc. | |
|---|---|---|---|
| Pavani (Patient) | 20 | 3 | 1 |
| Raghu (Nurse) | 7 | 4 | 13 |
| Zakir (Teacher) | 8 | 6 | 10 |
| Sahana (Student) | |||
| Julie (________) | 8 | 10 | 6 |
- How much time does Sahana spend per day in each of these body-states? Make a reasonable guess and fill her row in the table.
- Guess what activity or work Julie could be engaged in based on the data. Find out what your classmates’ guesses are.
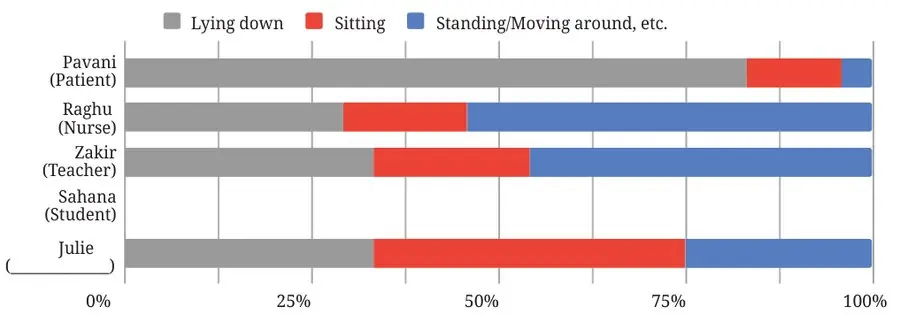
- Complete the chart below based on the tabular data.
First, understand the question
The table shows how many hours 5 people spend lying down, sitting, and standing or moving in a day. Sahana’s row is empty and Julie’s work is unknown. Every row must add up to 24 hours.
Given
- Hours per day for Pavani, Raghu, Zakir and Julie
- Sahana is a student; each row = 24 hours
To find
- (i) A guess for Sahana’s hours
- (ii) Julie’s possible work
- (iii) The completed 100% stacked chart
Write this in your exam
(i) Sahana (student): lying down 9 h, sitting 9 h, standing/moving 6 h (total 24 h).
(ii) Julie sits for 10 hours, so she may have a desk job (office worker, cashier or driver).
(iii) Each bar = 24 h = 100%. Share = hours ÷ 24 × 100.
Sahana: 9/24 = 37.5%, 9/24 = 37.5%, 6/24 = 25%
∴ Fill the table and draw the bars as shown in the solution.
(i) Sahana (student): lying down 9 h, sitting 9 h, standing/moving 6 h (total 24 h).
(ii) Julie sits for 10 hours, so she may have a desk job (office worker, cashier or driver).
(iii) Each bar = 24 hours = 100%.
For example, Sahana (lying down):
∴ Fill the table and draw the bars as shown in the solution.
Show step-by-step solutionHide step-by-step solution
(i) Make a reasonable guess for Sahana
Think of a student’s day: sleep, school, homework and games. The total must be 24 hours.
Body-state Hours Why? Lying down 9 about 8–9 hours of sleep Sitting 9 school classes, homework, meals, tuition Standing / moving 6 games, PE, travel, chores Total 24 must add to 24 hours (ii) Guess Julie’s work
Julie spends a long time sitting (10 hours), so she could be an office worker, bank employee, computer operator, cashier or driver. (Any reasonable desk-job answer is acceptable.)
(iii) Change hours into % of 24 hours
Share = hours ÷ 24 × 100. Each bar then becomes 100%.
Person Lying down Sitting Standing/Moving Pavani 20/24 ≈ 83% 3/24 = 12.5% 1/24 ≈ 4% Raghu 7/24 ≈ 29% 4/24 ≈ 17% 13/24 ≈ 54% Zakir 8/24 ≈ 33% 6/24 = 25% 10/24 ≈ 42% Sahana 9/24 = 37.5% 9/24 = 37.5% 6/24 = 25% Julie 8/24 ≈ 33% 10/24 ≈ 42% 6/24 = 25% Each bar = 24 hours = 100%. (Sahana’s bar is based on our guess of 9 : 9 : 6.) Think and Reflect (page 30)
- Different teacher? Mostly similar (teachers stand while teaching), but it can differ a little. For example, a PE teacher moves more, and a teacher who checks many notebooks sits more.
- All 7 days? Yes, the bars can change. The routine is different on weekends: a student may sleep more, and a teacher does not go to school.
- Other people with similar bars: similar to Raghu — waiter, traffic police, salesperson, farmer; similar to Julie — driver, cashier, software engineer; similar to Pavani — a sick or bedridden person.
End-of-Chapter Exercises — Miscellaneous: all 16 questions
NCERT page 30–36
End-of-Chapter Exercises · Run rate
Q1In cricket, the run rate is the average number of runs scored per over. In a T20 match, a team scored 6 runs in the first over making the run rate 6.
- In the second over they scored 12 runs. What is the run rate now?
- After Over 19, their run rate was 6. What is the run rate after 20 overs given the team made 12 runs in the last over?
First, understand the question
Run rate means the average number of runs scored per over. In (i), one more over is added to the first over. In (ii), we know the run rate after 19 overs and then add the 20th over.
Given
- Over 1: 6 runs; Over 2: 12 runs
- After 19 overs: run rate 6; Over 20: 12 runs
To find
- (i) Run rate after 2 overs
- (ii) Run rate after 20 overs
Write this in your exam
Run rate = Total runs ÷ Total overs
(i) Run rate = (6 + 12) ÷ 2 = 18 ÷ 2 = 9
(ii) Runs in 19 overs = 19 × 6 = 114
Run rate after 20 overs = (114 + 12) ÷ 20 = 126 ÷ 20 = 6.3
∴ (i) Run rate = 9 (ii) Run rate = 6.3
(i)
(ii)
∴ (i) Run rate = 9 (ii) Run rate = 6.3
Show step-by-step solutionHide step-by-step solution
Recall the formula
Run rate = Total runsTotal overs(i) Find the run rate after 2 overs
Run rate = 6 + 122 = 182 = 9Move 3 runs from Over 2 to Over 1: both become 9 runs. (ii) Find the runs scored in 19 overs
Total runs = run rate × number of overs.
Runs in 19 overs = 19 × 6 = 114(ii) Add the 20th over and divide by 20
Run rate after 20 overs = 114 + 1220 = 12620 = 6.3
End-of-Chapter Exercises · Shuttlecock prices
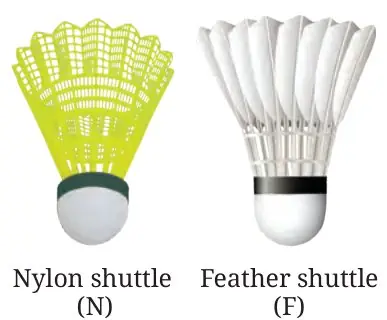
Q2Five friends who play badminton surveyed the city and collected the price of shuttlecocks across brands and types (Nylon and Feather). The following is the list of the prices, in rupees (₹), that each one compiled.
Yusuf: 40(N), 105(N), 383(F), 108(N), 165(F), 116(F)
Srikanth: 194(N), 85(N), 93(N), 121(N)
Kashvi: 49(N), 297(F), 105(N), 275(F), 40(N)
Prasanna: 124(N), 333(F), 182(N), 258(F)
Gracy: 220(F), 458(F), 129(F), 183(N)
Can you describe a way they can work together to find the average price of a shuttlecock across types?
- Each one calculated the average of the prices they had gathered. Suppose these are ay, as, ak, ap, ag respectively. Write an expression that gives the combined average.
- Suppose an, af are the average prices of the nylon shuttlecocks and the feather shuttlecocks, respectively. Write an expression that gives the average price of a shuttlecock. Will this be equal to the answer we got using the method in the previous part?
First, understand the question
Five friends collected shuttlecock prices. Each friend has a different number of prices, so a bigger list must count more. We find the overall average in two ways: friend-wise, and type-wise (nylon / feather).
Given
- Price lists of 5 friends (23 prices in all)
- 13 nylon and 10 feather shuttlecocks
To find
- A way to find the overall average
- (i) Expression using ay, as, ak, ap, ag
- (ii) Expression using an, af, and whether it is the same
Write this in your exam
Way: add the sums of all the lists and divide by the total count (23).
(i) Combined average = (6ay + 4as + 5ak + 4ap + 4ag) ÷ (6 + 4 + 5 + 4 + 4) = (6ay + 4as + 5ak + 4ap + 4ag) ÷ 23
(ii) Average = (13an + 10af) ÷ (13 + 10) = (13an + 10af) ÷ 23
Yes, both are equal (≈ ₹176.65), because both are the sum of all 23 prices ÷ 23.
∴ Both methods give ≈ ₹176.65.
Way: each friend shares the sum and the number of prices. Add all the sums and divide by the total count (23).
(i) Let x̄ = the combined average.
(ii)
Yes, both are equal, because both are the sum of all 23 prices divided by 23:
∴ Both expressions give the same average price, ≈ ₹176.65.
Show step-by-step solutionHide step-by-step solution
Plan how to work together
Way to work together: Each friend shares the sum and the count of the prices in their list. Add all the sums and divide by the total count (23). (Equivalently, multiply each friend’s average by their count — this is the weighted average.)
Friend Count (w) Nylon Feather Sum (₹) Average Yusuf 6 3 3 917 ay ≈ 152.83 Srikanth 4 4 0 493 as = 123.25 Kashvi 5 3 2 766 ak = 153.2 Prasanna 4 2 2 897 ap = 224.25 Gracy 4 1 3 990 ag = 247.5 Total 23 13 10 4063 ≈ 176.65 (i) Combine the five averages
Each friend’s average is weighted by the number of prices in that friend’s list.
Combined average = 6ay + 4as + 5ak + 4ap + 4ag6 + 4 + 5 + 4 + 4 = 6ay + 4as + 5ak + 4ap + 4ag23(ii) Combine the nylon and feather averages
Total nylon = 13, total feather = 10.
Average price = 13an + 10af13 + 10 = 13an + 10af23an = 142913 ≈ 109.92, af = 263410 = 263.4 ⇒ 1429 + 263423 = 406323 ≈ ₹176.65Yes, both are equal. In both methods the numerator is the sum of all 23 prices (₹4063) and the denominator is 23. The prices are only grouped differently.
End-of-Chapter Exercises · Average price of shares
Q3Shreyas holds 25 shares of a company at an average price of ₹150 and Vaishnavi holds 5 shares of the same company at an average price of ₹150.
- Shreyas buys 10 shares of this company at a price of ₹30 each. What is the average price per share for him after the purchase?
- Vaishnavi buys some shares of this company at a price of ₹30 each and the average price per share for her after the purchase is ₹70. How many shares did she buy?
First, understand the question
Average price per share = total money paid ÷ total number of shares. Buying cheaper shares pulls the average price down. In (ii) we know the new average and have to find how many shares were bought.
Given
- Shreyas: 25 shares at ₹150; buys 10 more at ₹30
- Vaishnavi: 5 shares at ₹150; buys n more at ₹30; new average ₹70
To find
- (i) Shreyas’s new average price
- (ii) Number of shares Vaishnavi bought
Write this in your exam
(i) Average = (25 × 150 + 10 × 30) ÷ (25 + 10) = (3750 + 300) ÷ 35 = 4050 ÷ 35 ≈ ₹115.71
(ii) Let her buy n shares.
(5 × 150 + 30n) ÷ (5 + n) = 70
750 + 30n = 350 + 70n ⇒ 40n = 400 ⇒ n = 10
∴ (i) ≈ ₹115.71 per share (ii) 10 shares
(i)
(ii) Let her buy n shares.
∴ (i) ≈ ₹115.71 per share (ii) She bought 10 shares.
Show step-by-step solutionHide step-by-step solution
(i) Find Shreyas’s new average price
Total cost = number of shares × price per share.
Average = 25 × 150 + 10 × 3025 + 10 = 3750 + 30035 = 405035 ≈ ₹115.71(ii) Take the number of new shares as n and solve
5 × 150 + n × 305 + n = 70 ⇒ 750 + 30n = 350 + 70n ⇒ 400 = 40n ⇒ n = 10Gap ratio 40 : 80 = 1 : 2, so the shares are in the reverse ratio 2 : 1 = 10 : 5.
End-of-Chapter Exercises · Pṛthūdakasvāmī (c. 864 CE)
(Pṛthūdakasvāmī, commentary on Brahmagupta’s Brāhmasphuṭasiddhānta, c. 864 CE) A “hasta” (meaning “forearm”) refers to a unit of length measuring around 18 inches.
Q4A pool 30 hastas long is dug to different depths along its length. It is divided into 5 sections having lengths 4, 5, 6, 7, and 8 hastas, and is dug to depths of 9, 7, 7, 3, and 2 hastas, respectively. Find the mean depth of the pool.
First, understand the question
The pool is divided into 5 sections of different lengths, and each section has a different depth. A longer section counts more, so the lengths are the weights.
Given
- Lengths: 4, 5, 6, 7, 8 hastas (total 30)
- Depths: 9, 7, 7, 3, 2 hastas
To find
- Mean depth of the pool
Write this in your exam
Mean depth = (4 × 9 + 5 × 7 + 6 × 7 + 7 × 3 + 8 × 2) ÷ (4 + 5 + 6 + 7 + 8)
= (36 + 35 + 42 + 21 + 16) ÷ 30
= 150 ÷ 30 = 5
∴ Mean depth of the pool = 5 hastas.
Multiply each length by its depth:
Let d = mean depth of the pool.
Show step-by-step solutionHide step-by-step solution
Multiply each length by its depth
A longer section is a bigger part of the pool, so its length is the weight.
4 × 9 = 36, 5 × 7 = 35, 6 × 7 = 42, 7 × 3 = 21, 8 × 2 = 16Add the products and divide by the total length
Mean depth = 4 × 9 + 5 × 7 + 6 × 7 + 7 × 3 + 8 × 24 + 5 + 6 + 7 + 8 = 36 + 35 + 42 + 21 + 1630 = 15030 = 5Dashed line = mean depth: if the whole pool had one depth, it would be 5 hastas deep.
End-of-Chapter Exercises · Average price of gold
Q5Suvarna had purchased 1g gold at ₹15k (short for ₹15,000). This is shown by point O denoting the average price of gold that she possesses. Six different scenarios are given below for her next transaction. For each scenario estimate and mark the average price of gold she will have after the transaction.
- Purchase 1g gold at ₹30k
- Purchase 2g gold at ₹30k
- Purchase 1g gold at ₹10k
- Purchase 10g gold at ₹10k
- Purchase 0.5g gold at ₹30k
- Purchase 0.5g gold at ₹15k

First, understand the question
Suvarna already has 1 g of gold at ₹15k. In each case she buys more gold at a new price. Her average price moves towards the new price, and the more she buys, the closer it moves.
Given
- Already has: 1 g at ₹15k (point O)
- Six different purchases, (i) to (vi)
To find
- The new average price in each case, marked on the number line
Write this in your exam
New average = (1 × 15 + w × x) ÷ (1 + w), where w g is bought at ₹x k
(i) (15 + 30) ÷ 2 = 22.5k (ii) (15 + 60) ÷ 3 = 25k
(iii) (15 + 10) ÷ 2 = 12.5k (iv) (15 + 100) ÷ 11 ≈ 10.45k
(v) (15 + 15) ÷ 1.5 = 20k (vi) (15 + 7.5) ÷ 1.5 = 15k
∴ 22.5k, 25k, 12.5k, ≈ 10.45k, 20k, 15k
Let w g of gold be bought at ₹x k. Then
∴ Mark these six points on the number line.
Show step-by-step solutionHide step-by-step solution
Write the rule
The old gold (1 g at ₹15k) is the same in every case. Only the new quantity w and the new price x change.
New average = 1 × 15 + w × x1 + wWork out each case
Part Calculation Average price (i) 1×15 + 1×302 ₹22.5k (ii) 1×15 + 2×303 ₹25k (iii) 1×15 + 1×10² ₹12.5k (iv) 1×15 + 10×1011 ≈ ₹10.45k (v) 1×15 + 0.5×301.5 ₹20k (vi) 1×15 + 0.5×151.5 ₹15k Mark the answers on the number line
The more gold she buys at the new price, the closer her average moves to that price.
End-of-Chapter Exercises · Doubling all weights
Q6Given some data with corresponding weights, how would the weighted average change if all the weights are doubled? If required, experiment with some data. What do you observe? Justify your answer using algebra.
First, understand the question
We have to see what happens to a weighted average when every weight is doubled. First we try an example, and then we prove it using algebra.
Given
- Any data x₁, x₂, … with weights w₁, w₂, …
- Every weight is doubled
To find
- How the weighted average changes, with an algebraic proof
Write this in your exam
Example: (3 × 40 + 1 × 60) ÷ 4 = 45; doubled: (6 × 40 + 2 × 60) ÷ 8 = 45
New average = (2w₁x₁ + … + 2wₙxₙ) ÷ (2w₁ + … + 2wₙ)
= 2(w₁x₁ + … + wₙxₙ) ÷ 2(w₁ + … + wₙ) = x̄
∴ The weighted average does not change.
Example: weights 3, 1, and then the doubled weights 6, 2:
In general, when every weight is doubled:
∴ The weighted average does not change.
Show step-by-step solutionHide step-by-step solution
Try an example
Data Weights Weighted average ₹40/kg, ₹60/kg 3 kg, 1 kg 3×40 + 1×604 = 1804 = 45 ₹40/kg, ₹60/kg 6 kg, 2 kg (doubled) 6×40 + 2×608 = 3608 = 45 Chocolate ₹10, toffee ₹20 1, 1 → 2, 2 15 → 15 Observation: The weighted average does not change at all.
Prove it using algebra
Take 2 common from the numerator and the denominator. It cancels out.
New average = 2w1x1 + 2w2x2 + … + 2wnxn2w1 + 2w2 + … + 2wn = 2(w1x1 + … + wnxn)2(w1 + … + wn) = w1x1 + … + wnxnw1 + … + wn = x̄
End-of-Chapter Exercises · Objects orbiting Earth
Q7Answer the following questions based on the graph.
- In 2003, approximately how many total objects were found orbiting Earth in space? In what year did this number double?
- Find the approximate number and share of payload objects and other objects in the year 2025.
- What can you say about the number of payload objects over time, and the number of other objects over time? What can you say about the share of payload objects over time, and the share of other objects over time?

First, understand the question
The graph shows the total number of objects orbiting Earth in each year, split into payload objects and other objects. Readings from a graph are approximate.
Given
- Stacked bar graph of objects orbiting Earth, by year
- Two parts: payload objects and other objects
To find
- (i) Total in 2003, and the year it doubled
- (ii) Number and share of each type in 2025
- (iii) Trends in the numbers and the shares
Write this in your exam
(i) In 2003, total ≈ 10,000 objects. It doubled (≈ 20,000) around 2021.
(ii) 2025: total ≈ 33,000; payload ≈ 17,000 (≈ 52%), others ≈ 16,000 (≈ 48%).
Share = part ÷ total × 100
(iii) Both numbers keep increasing. The payload share was small for many years but rose sharply after 2019, while the share of other objects fell.
∴ Readings are approximate; small differences are acceptable.
(i) In 2003 the total was about 10,000 objects. It doubled (about 20,000) around 2021.
(ii) In 2025: total ≈ 33,000, payload ≈ 17,000, others ≈ 16,000.
(iii) Both numbers keep increasing. The payload share was small for many years but rose sharply after 2019, while the share of other objects fell.
∴ Readings are approximate; small differences are acceptable.
Show step-by-step solutionHide step-by-step solution
(i) Read the 2003 bar and find when it doubles
The 2003 bar reaches about 10,000. Double = 20,000, which was reached around 2021.
(ii) Read the 2025 bar and find the shares
Share = part ÷ total × 100.
Approx. number Share Payload objects ≈ 17,000 1700033000 × 100 ≈ 52% Other objects ≈ 33,000 − 17,000 = 16,000 1600033000 × 100 ≈ 48% Total ≈ 33,000 100% (iii) Describe the trends
- Numbers: The numbers of both payload and other objects increased every year (it is a cumulative graph). Other objects grew steadily, with sudden jumps in some years (around 2007 and 2009, due to debris-creating events). Payload objects grew slowly until about 2018 and then very rapidly.
- Share: For most years the share of payload was small (in 2003, ≈ 2,400 out of 10,000 ≈ 24%), while other objects (debris, rocket stages) made up ≈ 75–80%. After 2019 the payload share rose sharply and reached about half (≈ 50%) by 2025. The share of other objects fell by the same amount.
End-of-Chapter Exercises · Schools with a playground
Q8Observe the following infographic.
- Identify the correct inference(s) from the statements given.
(a) More schools have a playground in Haryana compared to Uttarakhand.
(b) Approximately every 2 out of 3 schools in Arunachal Pradesh have a playground.
(c) Punjab has the highest number of schools with a playground.
(d) Suppose it is given that Maharashtra has more schools than Telangana. Then the number of schools having a playground is more in Maharashtra. - Using the information given, can we find the nation-wide percentage of schools with a playground? If not, what additional information is needed?

First, understand the question
The map shows the percentage of schools that have a playground in each State/UT. It does not show the number of schools. We have to decide which statements can really be inferred from it.
Given
- Percentage of schools with a playground, State/UT-wise
- Four statements, (a) to (d)
To find
- (i) The correct inference(s)
- (ii) Can we find the nation-wide %? If not, what is needed?
Write this in your exam
(a) Cannot infer: the map gives only %, not the number of schools.
(b) Correct: Arunachal 68% ≈ 2/3 (66.7%).
(c) Cannot infer: Punjab has a high %, not necessarily the highest number.
(d) Correct: more schools × higher % (93% > 74%) gives more playgrounds.
(ii) No. We need the number of schools in each State/UT (the weights).
∴ (i) (b) and (d) (ii) The number of schools in each State/UT is needed.
(a) Cannot infer: the map gives only percentages, not the number of schools.
(b) Correct: Arunachal Pradesh has 68%, and 2/3 ≈ 66.7%.
(c) Cannot infer: Punjab has a high percentage, not necessarily the highest number.
(d) Correct. If Maharashtra (M) has more schools than Telangana (T):
(ii) No. We need the number of schools in each State/UT (n) with its percentage (p). Then
∴ (i) (b) and (d) (ii) The number of schools in each State/UT is needed.
Show step-by-step solutionHide step-by-step solution
(i) Check each statement with the map
A percentage tells us “how many out of 100”, not the actual number.
Statement Map data Verdict Reason (a) Haryana 90%, Uttarakhand 78% Cannot infer The map shows only percentages, not the number of schools (b) Arunachal 68% Correct ✔ 2/3 = 66.7% ≈ 68% (c) Punjab 98% Cannot infer Highest %, not highest number (and Dadra & NH and Daman & Diu is 99.8%) (d) Maharashtra 93% > Telangana 74% Correct ✔ More schools × higher % = more playgrounds (d) explained: if M > T, then 0.93 × M > 0.93 × T > 0.74 × T. Hence Maharashtra has more schools with a playground.
(ii) Can we find the nation-wide %?
No. We need the total number of schools in each State/UT. Then the nation-wide percentage is a weighted average:
Nation-wide % = n1p1 + n2p2 + … n1 + n2 + … (n = schools in a state, p = its %)
End-of-Chapter Exercises · Decision dilemma
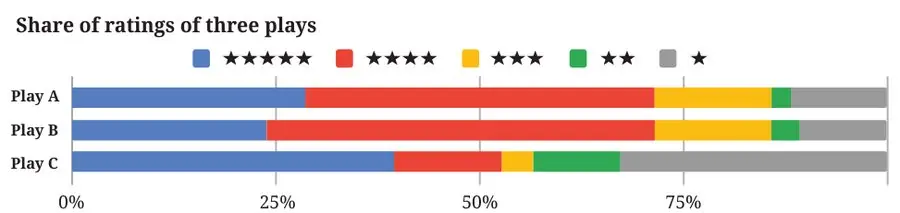
Q9Decision Dilemma:
- Which of the plays would you choose to watch based on the following chart?
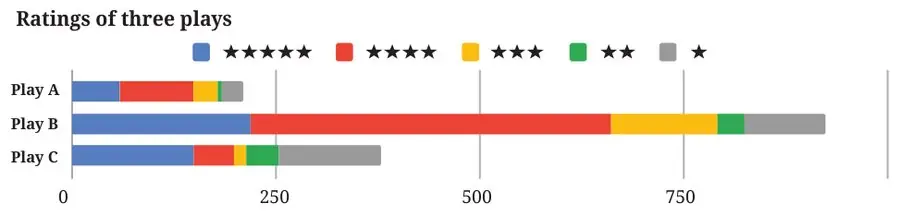
- The corresponding stacked bar chart is shown below. Would you change your decision after looking at this chart? Why/Why not? Discuss.
First, understand the question
Three plays are rated from 1★ to 5★. The first chart shows only the share (%) of each rating. The second chart shows the number of ratings. A decision can change once we also see how many people rated each play.
Given
- 100% stacked chart: share of ratings of plays A, B, C
- Stacked chart: number of ratings of plays A, B, C
To find
- (i) Which play to choose from the first chart
- (ii) Would the decision change after the second chart?
Write this in your exam
(i) Play A or B: about 70% of people give 4★ or 5★, and few give 1★. About one-third of Play C’s ratings are 1★.
(ii) Yes. A and B have almost the same shares, but about 930 people rated B and only about 210 rated A.
Ratings from more people are more reliable, so choose Play B.
∴ (i) Play A (or B) (ii) Many would switch to Play B.
(i) Play A or B: about 70% of people give 4★ or 5★, and few give 1★. About one-third of Play C’s ratings are 1★.
(ii) Yes. A and B have almost the same shares, but about 930 people rated B and only about 210 rated A.
Ratings from more people are more reliable, so choose Play B.
∴ (i) Play A (or B) (ii) Many would switch to Play B.
Show step-by-step solutionHide step-by-step solution
(i) Read the shares from the 100% chart
Play 5★ 4★ 3★ 2★ 1★ 4★ + 5★ A ≈ 28% ≈ 43% ≈ 15% ≈ 2% ≈ 12% ≈ 71% B ≈ 24% ≈ 48% ≈ 14% ≈ 3% ≈ 11% ≈ 72% C ≈ 40% ≈ 13% ≈ 4% ≈ 10% ≈ 33% ≈ 53% Choose Play A (or B). In both, about 70% of people give 4★ or 5★, and few give 1★. Play C has the most 5★ ratings, but about one-third of people also give 1★ (people either love it or dislike it). Play A has slightly more 5★ and the fewest 2★, so A looks slightly better.
(ii) Read the number of ratings from the stacked chart
A 100% chart hides how many people gave ratings. The stacked chart shows it.
Play Total ratings (approx.) Approx. average rating A ≈ 210 ≈ 3.7 ★ B ≈ 930 ≈ 3.7 ★ C ≈ 380 ≈ 3.2 ★ Yes, the decision can change → Play B. The shares of A and B are almost the same, but about 930 people rated B and only about 210 rated A. Ratings from more people are more reliable. Play B also has the most 5★ and 4★ ratings in number.
End-of-Chapter Exercises · Triathlon
Q10A triathlon is an endurance race consisting of swimming 3.8 km, cycling 180 km, and running 42.2 km. Athletes compete for the fastest overall time, completing each segment in that order. The following table shows the finish time of 3 athletes in each segment.
| Swimming | Cycling | Running | |
|---|---|---|---|
| Athlete 1 | 01:08 | 05:00 | 03:15 |
| Athlete 2 | 01:05 | 05:10 | 03:35 |
| Athlete 3 | 01:22 | 05:55 | 03:50 |
Table 10.4: values in hh : mm
- What is a suitable representation of this data — a stacked bar chart or a 100% stacked bar chart? Why do you think so?
- Suppose a 100% stacked bar chart is drawn. Which of the following question(s) can be answered by looking at just that chart?
(a) Who finished the race first?
(b) Approximately what fraction of their race time did Athlete 1 spend cycling?
(c) Which athlete took the longest for running?
First, understand the question
Three athletes swim, cycle and run. The winner is the one with the shortest total time. We have to choose the right type of chart, and see which questions a 100% stacked chart can answer.
Given
- Times of 3 athletes in swimming, cycling and running (hh : mm)
To find
- (i) Stacked or 100% stacked chart? Why?
- (ii) Which of (a), (b), (c) can be answered from a 100% chart?
Write this in your exam
Totals: Athlete 1 = 9 h 23 min (563 min), Athlete 2 = 9 h 50 min (590 min), Athlete 3 = 11 h 07 min (667 min)
(i) A stacked bar chart, because it shows the total time, which decides the winner.
(ii) (a) No: all bars are 100%, so the totals are hidden.
(b) Yes: Athlete 1 cycling = 300 ÷ 563 ≈ 53%, a little more than half.
(c) No: a 100% chart shows only shares, not the actual running time.
∴ (i) Stacked bar chart (ii) Only (b)
Total time of each athlete (in minutes):
(i) A stacked bar chart, because it shows the total time, which decides the winner.
(ii) (a) No: all bars are 100%, so the totals are hidden.
(b) Yes: the share of cycling for Athlete 1 is
(c) No: a 100% chart shows only shares, not the actual running time.
∴ (i) Stacked bar chart (ii) Only (b)
Show step-by-step solutionHide step-by-step solution
Find each athlete’s total time
Change hh : mm into minutes and add the three parts.
Total time In minutes Athlete 1 9 h 23 min 563 Athlete 2 9 h 50 min 590 Athlete 3 11 h 07 min 667 Shortest bar = winner (Athlete 1) All bars are equal, so the winner cannot be found from this chart. (i) Choose the right chart
Stacked bar chart. A race is won by the fastest overall time, and a stacked bar shows the total time (the length of the bar) as well as the time for each segment. In a 100% chart all bars become equal and the total is hidden.
(ii) Check each question with a 100% chart
Question From 100% chart? Why (a) Who finished first? ✘ No All bars are 100%, so totals are hidden (b) Fraction of time Athlete 1 spent cycling ✔ Yes 300563 ≈ 53% ≈ a little more than half (c) Who took longest for running? ✘ No Athlete 3 ran longest (3:50) but his running share (34.5%) is smaller than Athlete 2’s (36.4%)!
End-of-Chapter Exercises · Notice and wonder
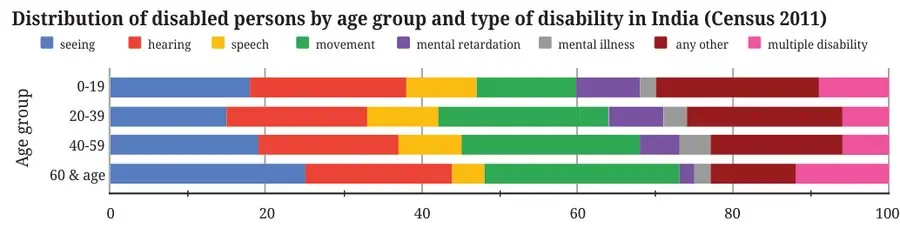
Q11Look at the following graph. What do you notice? What do you wonder? Write your inferences.
First, understand the question
This is a 100% stacked bar chart. Each bar is one age group, and the coloured parts show the share of each type of disability in that group. We have to write what we notice and what we wonder.
Given
- Census 2011 data for four age groups
- Share of each type of disability in every group
To find
- What we notice, what we wonder, and our inferences
Write this in your exam
Notice: the shares of seeing and movement disability increase with age.
Speech disability and mental retardation have higher shares in the young (0–19) and decrease with age.
Hearing disability is about 20% in every age group.
Wonder: how many people are in each age group? (A 100% chart does not show numbers.)
∴ Any correct observations like these are acceptable.
Notice: the shares of seeing and movement disability increase with age.
Speech disability and mental retardation have higher shares in the young (0–19) and decrease with age.
Hearing disability is about 20% in every age group.
Wonder: how many people are in each age group? (A 100% chart does not show numbers.)
∴ Any correct observations like these are acceptable.
Show step-by-step solutionHide step-by-step solution
Read the chart
Each bar = 100% of the disabled persons in that age group.
This is a 100% stacked bar chart. Each age group’s bar = all disabled persons in that group = 100%. (Readings are approximate.)
Type 0–19 20–39 40–59 60 & above Trend Seeing ≈ 18% ≈ 15% ≈ 19% ≈ 25% highest in elderly Hearing ≈ 20% ≈ 18% ≈ 18% ≈ 19% almost same Speech ≈ 9% ≈ 9% ≈ 8% ≈ 4% decreases with age Movement ≈ 13% ≈ 22% ≈ 23% ≈ 25% increases with age Mental retardation ≈ 8% ≈ 7% ≈ 5% ≈ 2% decreases with age Mental illness ≈ 2% ≈ 3% ≈ 4% ≈ 2% small, peaks at 40–59 Any other ≈ 21% ≈ 20% ≈ 17% ≈ 11% decreases Multiple ≈ 9% ≈ 6% ≈ 6% ≈ 12% high at both ends Write what you notice
- The shares of seeing and movement disability increase with age. In the 60+ group, these two together make up about half of all cases.
- The shares of speech disability and mental retardation are higher in the young age group (0–19) and decrease with age.
- The share of hearing disability is about 20% in every age group.
- Multiple disabilities are most common among the elderly (≈ 12%) and children (≈ 9%).
Write what you wonder
- How many people are actually in each age group? (A 100% chart does not show numbers.)
- Do seeing problems among the elderly increase because of cataract or old age?
- Has this pattern changed since 2011?
End-of-Chapter Exercises · Individual project
Q12Individual project: Do at least one of the following.
- Recall the previous day and fill in the approximate time spent lying down, sitting, and standing/moving around, etc. Ask at least 2 of your family members about their day and fill it in. Alternatively, you can choose to track just your own body-state for any one of the weekdays, Saturday, and Sunday. Visualise it using a stacked bar chart. Discuss with your class how you arrived at the estimated time spent in each state.
- Visualise your family’s monthly expenditure using a 100% stacked bar chart.
(a) First, identify the expense categories in your family budget. (b) Discuss with your family members to decide how you will collect and organise the data. (c) Collect expense data for at least 3 months. (d) Represent the data in a 100% stacked bar chart, with each bar showing how the total monthly expenditure is divided across the different categories. (e) Finally, write your observations and inferences based on the chart.
First, understand the question
This is a project. You collect your own data and draw a stacked bar chart (part i) or a 100% stacked bar chart (part ii). The sample below shows how to do part (i).
Given
- Hours spent lying down, sitting and standing/moving (part i)
- Monthly family expenses (part ii)
To find
- A stacked bar chart / 100% stacked bar chart with observations
Write this in your exam
(i) Note the hours of each body-state for each person; every total must be 24 hours.
Draw one bar for each person; start each part where the previous part ends.
(ii) Change each month’s expenses into % (category ÷ total × 100).
Draw one 100% bar for each month and write your observations.
∴ Use your own data; the sample shows the method.
(i) Note the hours of each body-state for each person. Every total must be 24 hours, for example:
Draw one bar for each person; start each part where the previous part ends.
(ii) Change each month’s expenses into percentages:
∴ Use your own data; the sample shows the method.
Show step-by-step solutionHide step-by-step solution
Collect the data
Sample answer for part (i) (use your own data):
Member Lying down Sitting Standing/Moving Exercise Total Member 1 8 9 6 1 24 Member 2 7 10 6 1 24 Member 3 8 8 7 1 24 Draw the stacked bar chart
Each bar = 24 hours. Mark: 8 → 8 + 9 = 17 → 17 + 6 = 23 → 24.
End-of-Chapter Exercises · Small-group project
Q13Small-group project: Make a group of 3–4 students. Choose one scenario to design a custom rating scheme by assigning appropriate weights: (a) shopping experience at a cloth store, (b) travel experience in a bus, (c) tourism experience of a nearby tourist spot, (d) clinic/hospital experience
- Discuss and arrive at 4–6 aspects to rate. For each aspect chosen, justify why it matters for an overall experience.
- Discuss and decide the relative weights and justify.
- Collect or imagine ratings from at least 10 people on a scale of 1–5 (5 being very good).
- Compute each individual rating. Compute the overall average across individuals.
- Make a 100% stacked bar chart using your data.
- Write a short note on the observations and inferences, what your rating system captures well and what it misses.
First, understand the question
This is a group project. You choose a scenario, pick 4–6 aspects, give each aspect a weight, collect ratings and find the weighted rating. The sample below is for a cloth store.
Given
- Scenarios: cloth store, bus travel, tourist spot, clinic/hospital
- Ratings from at least 10 people (1 to 5)
To find
- A weighted rating scheme, the overall average, a 100% chart and a short note
Write this in your exam
Aspects and weights: Quality 40%, Price 30%, Staff 20%, Cleanliness 10%
Rating of a person = 0.4Q + 0.3P + 0.2S + 0.1C
P1 = 0.4 × 5 + 0.3 × 4 + 0.2 × 4 + 0.1 × 4 = 4.4
Overall average = 41.7 ÷ 10 ≈ 4.17 ★
∴ Use your own data; the sample shows the method.
Aspects and weights: Quality 40%, Price 30%, Staff 20%, Cleanliness 10%.
∴ Use your own data; the sample shows the method.
Show step-by-step solutionHide step-by-step solution
Choose the aspects and their weights
Sample solution: (a) Shopping at a cloth store
Aspect Why it matters Weight Quality (Q) Clothes should be durable and of good quality 40% Price (P) Value for money 30% Staff behaviour (S) Helpfulness and politeness 20% Cleanliness (C) A pleasant environment 10% Find each person’s rating and the overall average
Multiply each rating by its weight and add.
(iii) & (iv) Individual rating = 0.4Q + 0.3P + 0.2S + 0.1C. Example P1: 0.4×5 + 0.3×4 + 0.2×4 + 0.1×4 = 2 + 1.2 + 0.8 + 0.4 = 4.4
Person Q P S C Rating P1 5 4 4 4 4.4 P2 4 4 4 4 4 P3 5 3 4 5 4.2 P4 4 5 3 4 4.1 P5 5 4 5 3 4.5 P6 3 4 4 4 3.6 P7 5 5 4 5 4.8 P8 4 3 3 4 3.5 P9 5 4 5 4 4.6 P10 4 4 5 2 4 Overall average = 41.710 ≈ 4.17 ★Draw the 100% stacked chart and write a note
100% stacked bar: distribution of the 10 ratings for each aspect. (vi) Note: The store’s quality and prices are good (overall ≈ 4.2/5). Our system gives the highest weight to what matters most to customers (quality and price). It misses aspects such as billing speed, parking and variety of sizes, and 10 customers is a small sample.
End-of-Chapter Exercises · Whole class project
Q14Whole class project: Each student shares the average age of their family and the number of family members. Discuss among the class and come up with a way to find out the average age of all the families of the class.
First, understand the question
Each family has a different number of members, so a bigger family must count more. We need a way to find the average age of all the families taken together.
Given
- Average age of each student’s family
- Number of members in each family
To find
- A method to find the average age of all the families
Write this in your exam
Let family k have wₖ members with average age xₖ. Total age = wₖ × xₖ.
Average age = (w₁x₁ + w₂x₂ + … + wₙxₙ) ÷ (w₁ + w₂ + … + wₙ)
Example: (4 × 30 + 5 × 28 + 3 × 35 + 6 × 26) ÷ 18 = 521 ÷ 18 ≈ 28.9 years
∴ Use the weighted average with family sizes as the weights.
Let family k have wₖ members with average age xₖ, and let x̄ = average age of all the families.
Example with 4 families:
∴ Use the weighted average with family sizes as the weights.
Show step-by-step solutionHide step-by-step solution
Find the total age of each family
Total age = number of members × average age.
Let the average age of student k’s family = xk and the number of members = wk. Total age of the family = wk × xk.
Write the formula
Average age of all families = w1x1 + w2x2 + … + wnxnw1 + w2 + … + wnTry an example
Student Members (w) Average age (x) w × x A 4 30 120 B 5 28 140 C 3 35 105 D 6 26 156 Total 18 521 Average age = 52118 ≈ 28.9 years
End-of-Chapter Exercises · ★ Adding 1 to every weight
Q15Given some data with corresponding weights, what would happen to the weighted average if all the weights are increased by a constant value, say 1? If required, experiment with some data. What do you observe? Justify your answer using algebra.
First, understand the question
We have to see what happens to a weighted average when 1 is added to every weight. First we try some examples, and then we prove it using algebra.
Given
- Any data x₁, x₂, … with weights w₁, w₂, …
- 1 is added to every weight
To find
- How the weighted average changes, with an algebraic proof
Write this in your exam
Example (₹10 and ₹20): weights 4, 1 give 12; weights 5, 2 give 90 ÷ 7 ≈ 12.86 (increases).
Weights 1, 4 give 18; weights 2, 5 give 120 ÷ 7 ≈ 17.14 (decreases).
New average = (Σwᵢxᵢ + Σxᵢ) ÷ (W + n) = (W·x̄ + n·m) ÷ (W + n), where m = simple average
So the new average lies between x̄ and m.
∴ It moves towards the simple average; it may increase or decrease.
Example with prices ₹10 and ₹20:
In general, let W = sum of the weights, x̄ = weighted average and m = simple average of the n values.
So the new average lies between x̄ and m.
∴ It moves towards the simple average; it may increase or decrease.
Show step-by-step solutionHide step-by-step solution
Try some examples
Weights Weighted average After +1 to each weight New average Change 4 kg, 1 kg 605 = 12 5 kg, 2 kg 907 ≈ 12.86 ↑ (towards 15) 1 kg, 4 kg 905 = 18 2 kg, 5 kg 1207 ≈ 17.14 ↓ (towards 15) 3 kg, 3 kg 15 4 kg, 4 kg 15 no change Observation: The weighted average changes. It always moves towards the simple (ordinary) average: sometimes it increases and sometimes it decreases.
Prove it using algebra
Let W = w1 + … + wn, x̄ = ΣwixiW (weighted), m = Σxin (simple average)New average = Σ(wi + 1)xiΣ(wi + 1) = Σwixi + ΣxiW + n = W·x̄ + n·mW + nSo the new average is itself a weighted average of x̄ and m, so it lies between them. It equals x̄ only when x̄ = m (for example, when all weights are equal).
End-of-Chapter Exercises · ★ Farm animals
Q16A farm has some cows, sheep, and chickens. Last year the cows made up 60%, the sheep 25%, and the chickens 15%. There was a decrease in the number of all three animals’ population over the year. Choose the possibilities for the change in their respective shares of the population —
- % of cows decreased, % of sheep decreased, % of chickens decreased
- % of cows increased, % of sheep increased, % of chickens increased
- % of cows remained the same, % of sheep remained the same, % of chickens remained the same
- % of cows decreased, % of sheep increased, % of chickens remained the same
- % of cows increased, % of sheep increased, % of chickens decreased.
First, understand the question
The number of every animal went down. But shares (%) are parts of the total, and the three shares must always add up to 100%. We have to check which changes in the shares are possible.
Given
- Last year: cows 60%, sheep 25%, chickens 15%
- The number of every animal decreased
To find
- Which of the five options are possible
Write this in your exam
The three shares always add up to 100%.
(i) All three shares cannot decrease: the total would be less than 100%. ✘
(ii) All three shares cannot increase: the total would be more than 100%. ✘
(iii) Possible, e.g. 48 cows, 20 sheep, 12 chickens: 60%, 25%, 15%.
(iv) Possible, e.g. 44, 24, 12: 55%, 30%, 15%. (v) Possible, e.g. 50, 21, 9: 62.5%, 26.25%, 11.25%.
∴ Possible: (iii), (iv), (v). Not possible: (i), (ii).
The three shares always add up to 100%, so all three cannot decrease together (i) or increase together (ii).
Take last year = 100 animals (60 cows, 25 sheep, 15 chickens) and 80 animals this year:
∴ Possible: (iii), (iv), (v). Not possible: (i), (ii).
Show step-by-step solutionHide step-by-step solution
Use the key fact
Key idea: However much the numbers decrease, the three shares always add up to 100%. So all three shares cannot increase together, and cannot decrease together.
Test each option with an example
Take last year = 100 animals (60 cows, 25 sheep, 15 chickens) and make every number smaller.
Let last year = 100 animals (60 cows, 25 sheep, 15 chickens). This year every number is smaller:
Option Example this year (C, S, Ch) Shares Possible? (i) — total would be < 100% ✘ Impossible (ii) — total would be > 100% ✘ Impossible (iii) 48, 20, 12 (total 80) 60%, 25%, 15% ✔ Possible (iv) 44, 24, 12 (total 80) 55% ↓, 30% ↑, 15% = ✔ Possible (v) 50, 21, 9 (total 80) 62.5% ↑, 26.25% ↑, 11.25% ↓ ✔ Possible All numbers decreased (60→48/44/50, 25→20/24/21, 15→12/12/9), yet every bar is still 100%.
Chapter Summary: Revise Before the Exam
- Weighted mean of x1, …, xn with weights w1, …, wn: x̄ = w1x1 + w2x2 + … + wnxnw1 + w2 + … + wn
- Average of averages is found using the weighted mean (weights = sizes of groups). It is also used when values are added to or removed from data (stork, langurs, run rate).
- Weighted average is used to find the concentration of mixtures; the mixture always lies between the concentrations mixed, closer to the larger quantity.
- When parts have different sizes or importance, assign weights: rating systems, combining marks in a ratio.
- Doubling (or multiplying) all weights → no change. Adding the same number to all weights → average moves towards the simple average.
- Stacked bar charts are used in place of cluster bar charts when the total of each cluster also matters.
- 100% stacked bar charts, like pie charts, compare proportions, not absolute values.
- From a stacked bar chart we can make a 100% stacked bar chart, but not vice versa.
Frequently Asked Questions on Chapter 10
It is an average in which each value is multiplied by its weight (its size, quantity or importance) and the total is divided by the sum of the weights: x̄ = (w₁x₁ + w₂x₂ + … + wₙxₙ) ÷ (w₁ + w₂ + … + wₙ).
Because the two groups may not be of the same size. The bigger group must count more, so the combined average is found using the weighted mean with the group sizes as weights.
Always between the concentrations that are mixed, and closer to the one with the larger quantity.
It does not change, because both the numerator and the denominator are multiplied by the same number.
A stacked bar chart shows actual totals and their parts. A 100% stacked bar chart makes every bar equal to 100% and shows only the shares. A 100% chart can be made from a stacked chart, but not the other way round.
There are five exercise sets (10.1 to 10.5) with 17 questions, and 16 End-of-Chapter questions. All 33 questions are solved on this page.
Write the values and their weights, then the formula x̄ = (w₁x₁ + w₂x₂ + …) ÷ (w₁ + w₂ + …), put in the numbers, simplify, and end with a clear answer line. Every solution on this page has a “Write this in your exam” box in this format.
Questions and figures: NCERT Ganita Manjari, Grade 9, Part II, Chapter 10, used for educational purposes. Solutions and diagrams prepared by StudyParth for students.